Using the Workbench
The pgEdge AI DBA Workbench provides a browser-based interface for monitoring and managing PostgreSQL database estates. This guide covers the features available to users of the web client.
- Reviewing Dashboards describes the monitoring dashboard hierarchy and the metrics each level displays.
- Managing Alerts explains how to view, acknowledge, and manage alerts in the web interface.
- Using AI Features covers AI-powered summaries, analysis, and the Ask Ellie assistant.
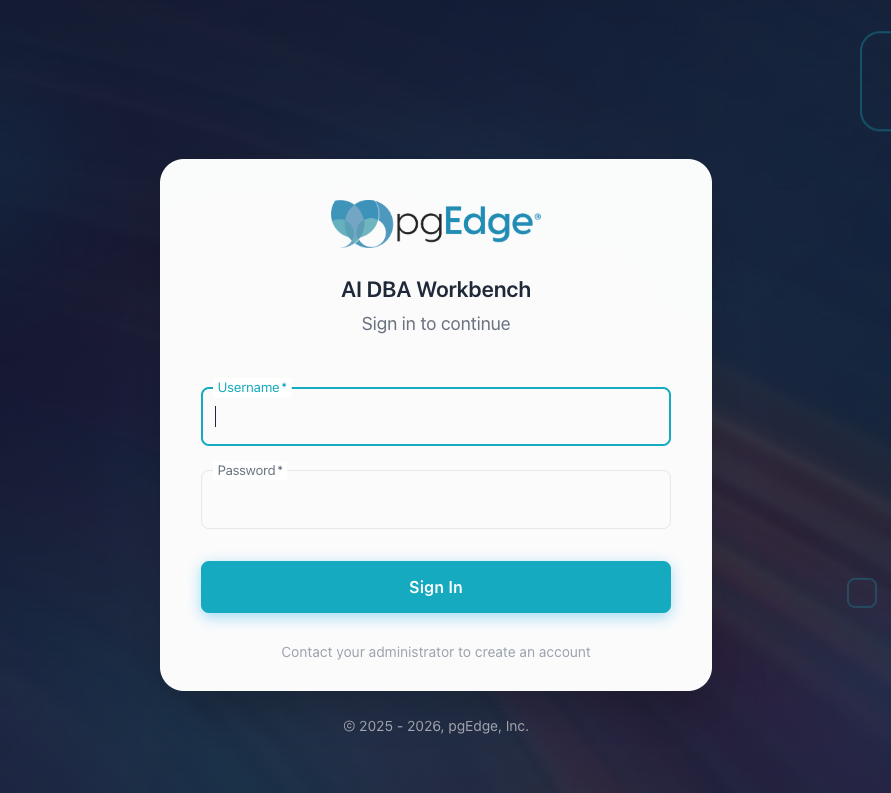
The Workbench client connects to an MCP server instance in your web browser. To connect to the client, open a browser and navigate to the server address. When prompted, log in with the user credentials provided during installation to begin monitoring your PostgreSQL estate.
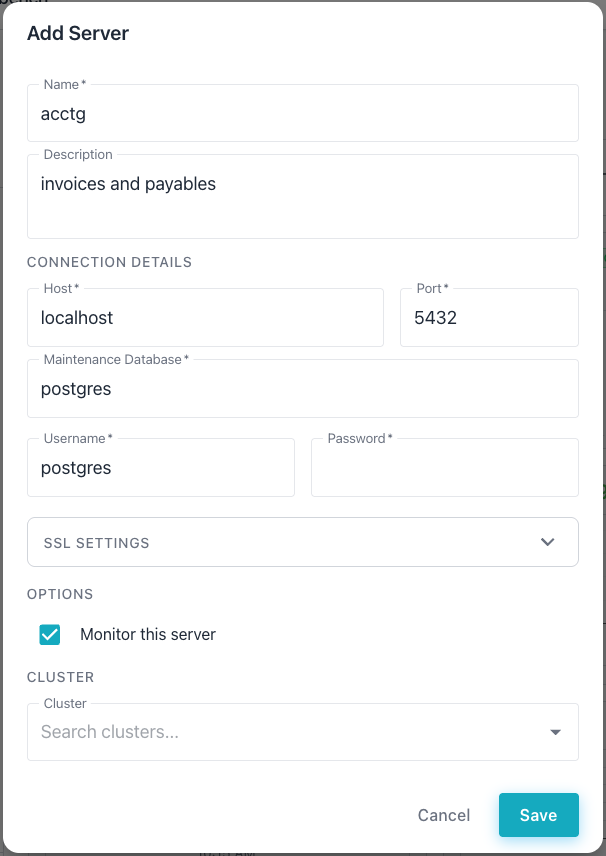
After logging in, select the + next to the DATABASE SERVERS heading in the
left navigation panel. The Workbench adds a new server definition entry.
The Workbench incorporates a number of features that simplify management of your database estate. Consistent and intuitive tooling make it easy to navigate through detailed metrics and alerts, resolving issues that may arise.
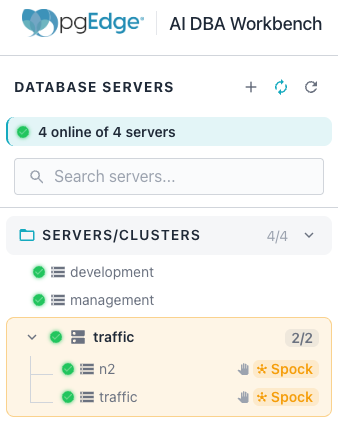
The cluster navigation pane occupies the left side of the console and provides tree-based navigation across groups, clusters, servers, and databases. Select a node in the navigator to review or update the dashboards, alerts, and AI insights for that scope.
Several panes, including the Navigation Pane, the Event Timeline, the
Query Plan, and the AI Overview, include a refresh icon. Use the refresh
icon to force an immediate update of the properties to reflect the latest
polled metrics (by default, metrics are collected every 5 minutes).