Dashboard Overview
Monitoring dashboards provide a hierarchical view of PostgreSQL database health and performance. You can navigate through five levels of detail, from a fleet-wide estate overview down to individual database objects.
The dashboard system organizes metrics into five levels that progress from broad to specific. Select items in the cluster navigator or click drillable elements within each dashboard to move between levels.
- The ESTATE DASHBOARD shows fleet-wide health across all monitored servers.
- The CLUSTER DASHBOARD focuses on replication topology and comparative metrics across cluster members.
- A SERVER DASHBOARD displays system resources and PostgreSQL performance for a single server.
- A DATABASE DASHBOARD presents table and index leaderboards with vacuum status for one database.
- An OBJECT DASHBOARD provides detailed metrics for a specific table, index, or query.
Hint
If you have enabled an AI provider, the Workbench
displays an informational analysis of each dashboard that you visit, and an
Ask Ellie chat assistant for interactive help. See
Using AI Features and Ask Ellie for
details.
Using Common Dashboard Features
Monitoring dashboards share a set of common UI features across their panes. Most panes display a chevron on the right side of the pane heading. Click the chevron to expand or collapse the pane.
The dashboards include the following additional interactive features:
- Drillable elements let you navigate between dashboard levels; for example, clicking a database entry in Database Summaries opens the database dashboard, and clicking a server entry in Comparative Metrics opens the server dashboard.
- The Hide monitoring queries toggle on the
Top Queriespane filters out the Workbench's own monitoring queries. - Clicking a tile in the visual query plan diagram opens a popover with cost, row estimate, and filter details for that node.
Server nodes and clusters in the navigation pane display a gear icon to the right of the name when you hover over them with the mouse; click the gear icon to open the settings dialog for that resource. See Server Settings or Cluster Settings for details about the configuration of the selected node.
Using the Event Timeline
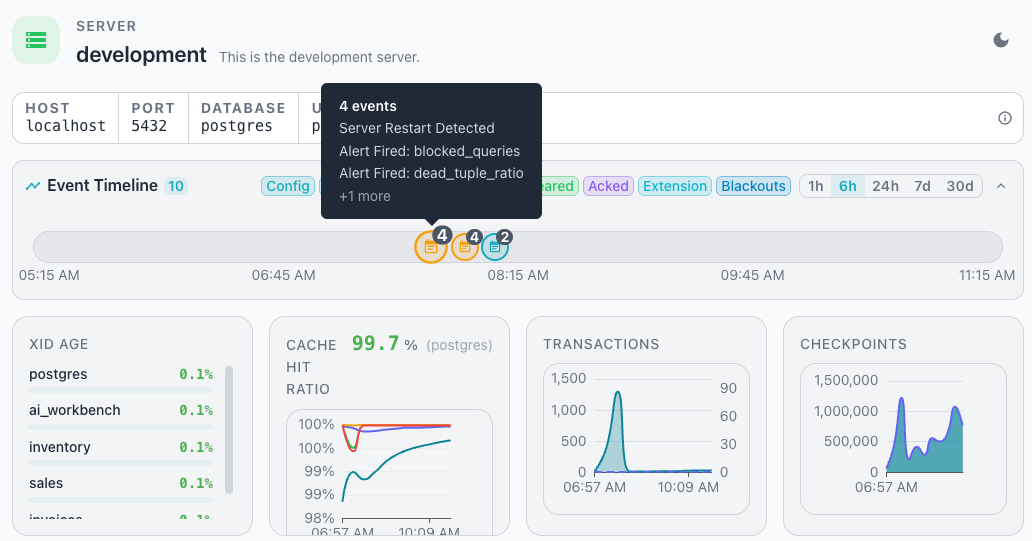
The Event Timeline displays a timeline with indicators that show monitored events that have occurred within the selected time range. The Event Timeline appears on the estate, cluster, and server dashboards, scoped to the servers monitored at that level.
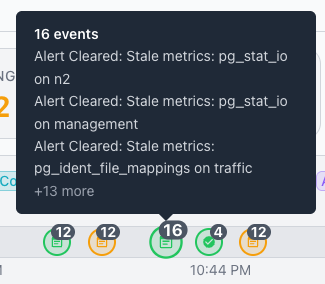
Select an event icon to review a list of the alert's events; when applicable, the details include the threshold values that caused the alert.
The time range selector in the Event Timeline pane specifies how far back the
pane displays events. The selector appears as a toggle button group with the
following options:
- 1h displays the last one hour of data.
- 6h displays the last six hours of data.
- 24h displays the last twenty-four hours of data.
- 7d displays the last seven days of data.
- 30d displays the last thirty days of data.
The selected time range persists across dashboard navigation. All time-series charts and KPI sparklines update when you change the time range.

Note
When no events fall within the selected range, the pane displays the
message No events in this time range. The pane suggests that you try
expanding the time range or adjusting the filters.
Monitored Event Types
You can use the event timeline to track the following event types by selecting
or deselecting the colored buttons between the Event Timeline label and the
time range selector:
| Button | Description |
|---|---|
| Config | Shows configuration change events for PostgreSQL settings. |
| HBA | Shows changes to the host-based authentication file (pg_hba.conf). |
| Ident | Shows changes to the ident authentication configuration (pg_ident.conf). |
| Restart | Shows server restart and recovery events. |
| Alert | Shows active alert events that have triggered. |
| Cleared | Shows alert events that have resolved and cleared. |
| Acked | Shows alert events that an operator has acknowledged. |
| Extension | Shows extension installation and upgrade events. |
| Blackouts | Shows scheduled maintenance blackout periods. |
Filtering and Stacking
The Event Timeline refreshes in sync with the cluster navigator refresh cycle. You can filter events by server and event type. When multiple events occur at the same point in time, the timeline stacks them into a single icon with a badge showing the event count; hovering over the icon displays a tooltip that lists individual event names and a "+N more" indicator when the group contains more than three events.