Using the AI Chart Analysis Feature
The AI chart analysis feature provides LLM-powered insights for any chart or KPI tile in the monitoring dashboards. The analysis examines data trends, identifies anomalies, and generates actionable recommendations.
Note
The Workbench's AI features are available only when the server has a configured LLM provider. See Enabling AI Mode for configuration details.
Charts, KPI tiles, leaderboards, and the vacuum status panes each display a brain icon in the upper-right icon. Click the icon to open an analysis dialog and start the LLM analysis.
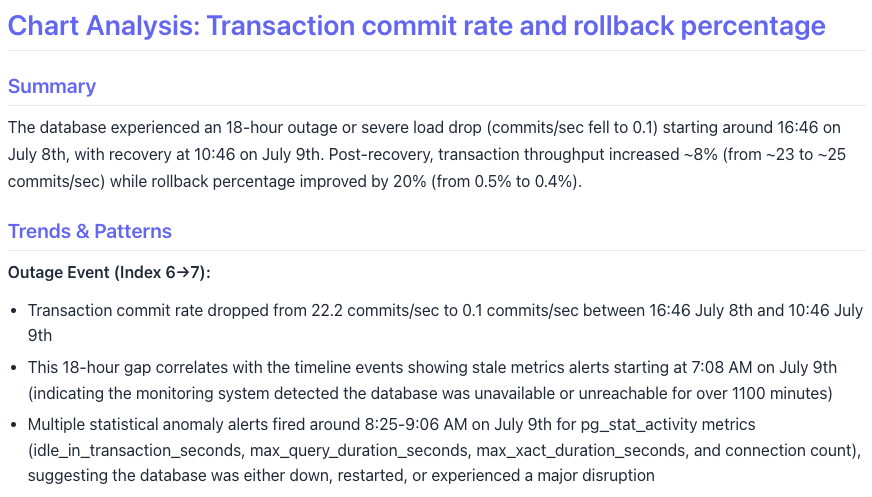
The chart analysis follows the same check-cache, fetch-context, fetch-events, send-to-LLM, produce-report process described in In-depth Object Analysis.
The AI analysis renders as formatted markdown. Each chart analysis report contains a structured assessment that includes a summary and detailed recommendations. Trends and patterns for the metrics that are used to generate the graph or chart are also included in the report.
Hint
Use the download icon in the upper-right corner of the dialog to download the analysis. The downloaded file is in markdown format, and includes the chart details, the full analysis report, and a generation timestamp.
The analysis includes events in the currently selected timeline to identify correlations between metric changes and system events. The LLM considers the following event types:
- Configuration changes to PostgreSQL settings.
- Alert activations and resolutions.
- Server restarts and recovery events.
- Extension installations and upgrades.
- Blackout periods and maintenance windows.
SQL code blocks included in the analysis report include a play button in the upper-right corner. Click the play button to execute the query against the chart's associated database server. Results appear inline below the code block.
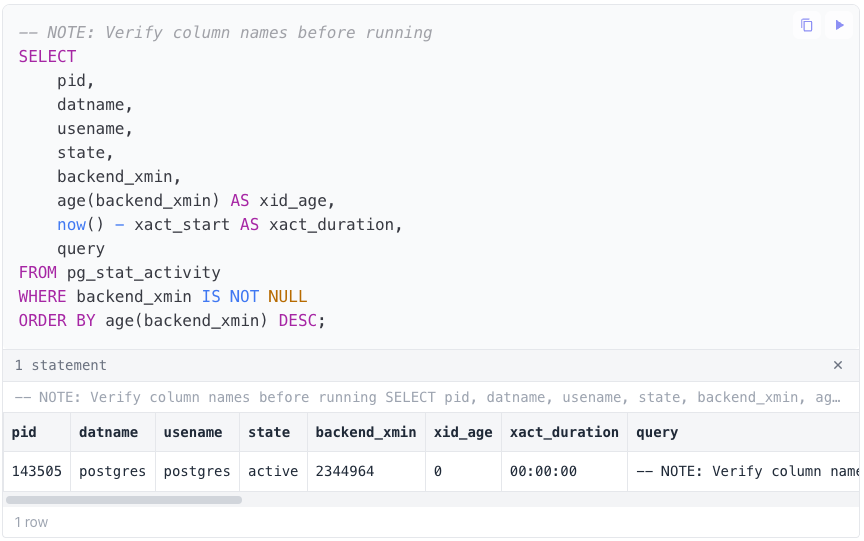
Write statements such as ALTER SYSTEM prompt a confirmation dialog before
executing. Read-only queries execute immediately.
The Workbench caches chart analysis results on the client side; an amber brain icon indicates a cached analysis exists. This caching behavior is described in AI Analysis and Overview Caching.